When your contributor is streaming into designated location, network conditions may mess the process which may result in content quality problems. Having stats right here right now allows checking the issues and determine potential sources of issues.
Larix Tuner collects these stats for real-time analysis. It also stores cumulative daily stats to see how your contributors performed over time.
Real time statistics for Larix Broadcaster sessions
When you log into Larix Tuner and go to Sessions menu, you can see past and current streaming sessions from devices in your account:
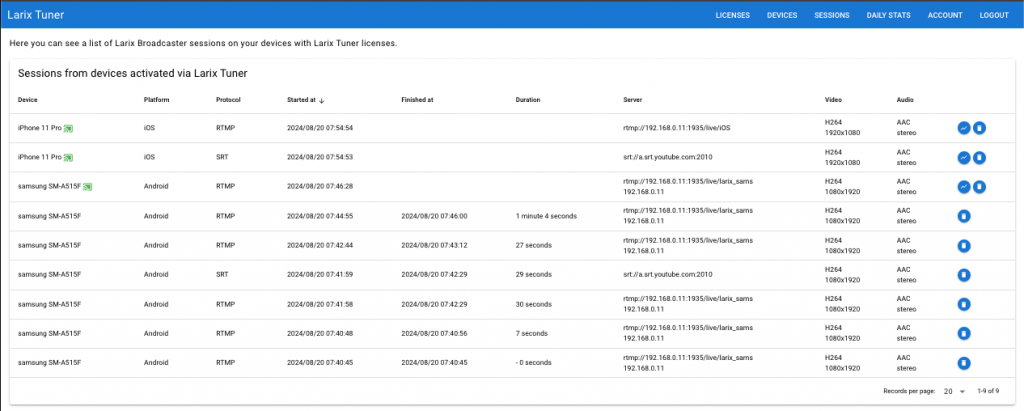
When you click on stats button on the right, you can view certain metrics as charts.
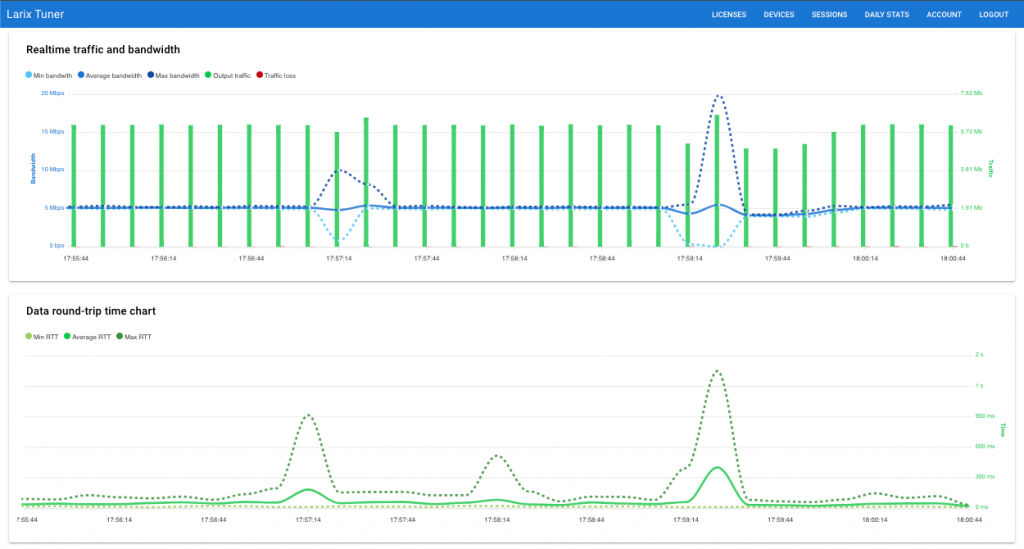
Currently Larix Tuner collect the following metrics:
- Bandwidth (a.k.a. bitrate, a.k.a transmission speed) – minimum, maximum and average.
- Output traffic
- Lost traffic
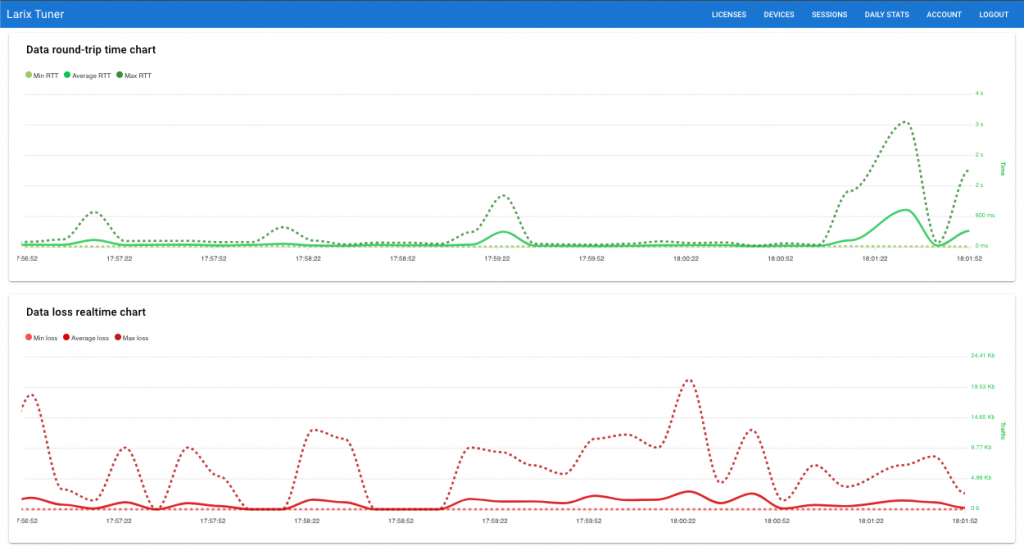
- RTT – min, max and average
- Data loss – min, max and average
The data is collected in 10-seconds chunks.
There are a few limitations: RTT values are not available for RTMP and RTPS on Android, as well as for WebRTC streams on any platform. All other data is fully available for other protocols.
At the moment, the real time stats are not stored in Larix Tuner after the session ends. If you need these stats to be stored for later usage, let us know so we could put this feature in our wish list.
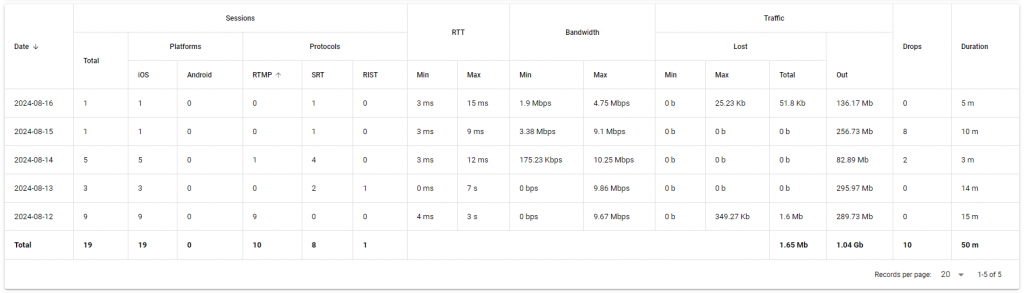
Daily stats
If you click on Daily stats top menu, you can see the statistics accumulated by days. It will have all metrics you saw in real-time stats, plus a bit more, like Duration, total traffic etc.
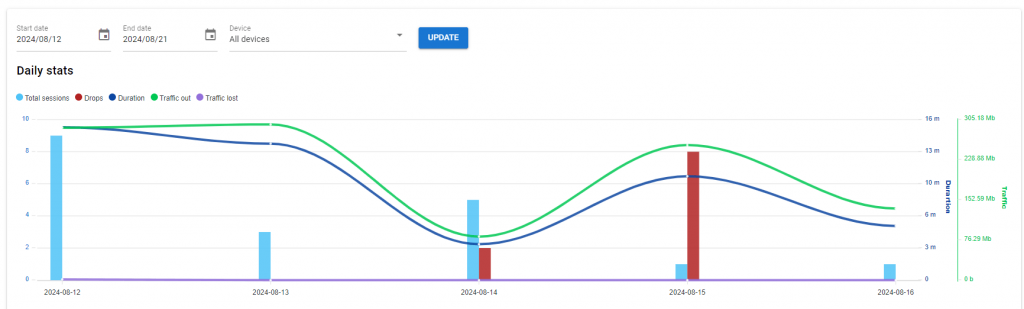
This information is also presented as a table which also includes breakdown by contribution protocol. If some protocols were not used during streaming, the respective columns will not be shown.
If you want to see more metrics or charts, please feel free to let us know about it.
Please also take a look at remote control capabilities like remote configuration and stream control.
Please also watch video tutorial about remote control feature set in action, including real-time stats.